30 Jun 2022
At this year’s Great Exhibition Road Festival, we created a short, anonymous form to collect the following variables:
- daily mobile phone screentime hours
- age
- gender
- most used app
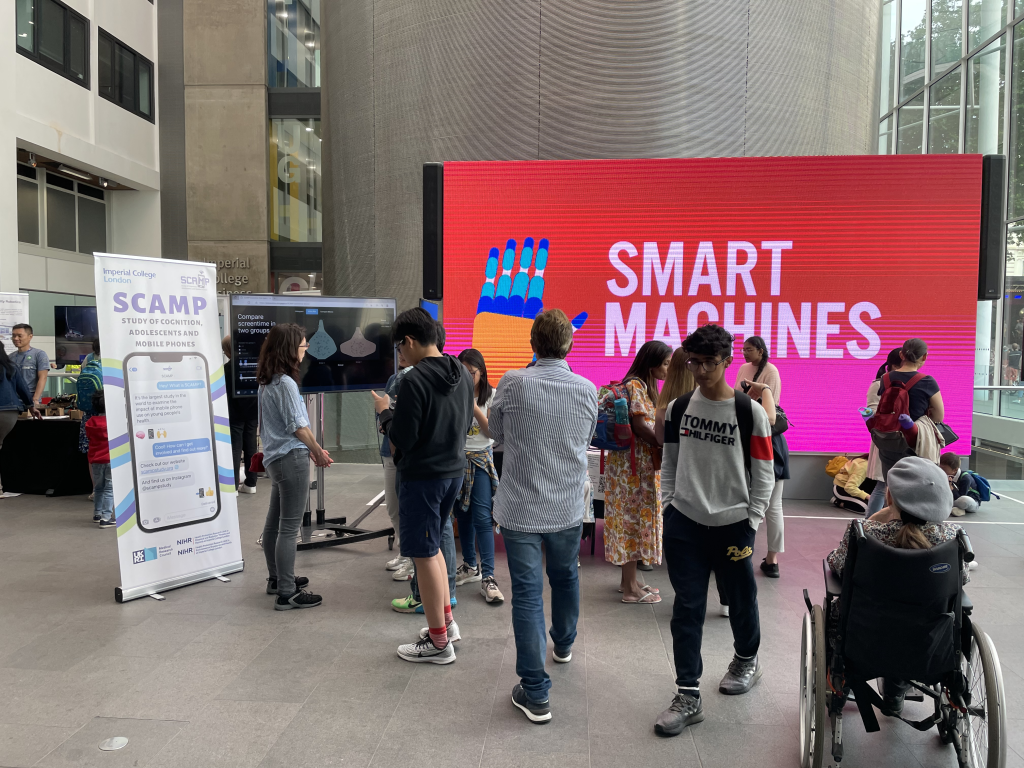
At the festival, we asked visitors to contribute to the form as a simulation of live research in action. We displayed the live results on a screen through a purpose built, customisable data visualisation browser app. The app allowed us to compare variables using a selection of graph type options – e.g. displaying side by side violin plots mapping the screen time of under 25 year olds versus over 25 year olds. We were able to update the display in real time to compare different variables during discussions with festival visitors. As such, we were able to discuss in depth how the results compared with visitor’s expectations and assumptions.
The process of checking mobile phone screentime records inspired far more questions than anticipated around the issues with using self-reported data to measure mobile phone use, which will be really helpful for our future app-based research. The participatory nature of the activity allows people contributing to assume the role of both participant and researcher, and gain a much deeper understanding of why we need multiple methods of data collection.
You can find all the responses and have a go at comparing them here: SCAMP Screentime Data Explorer (shinyapps.io)